We have recently explored alternative methods to effectively evaluate and convey our developers’ skill sets while also establishing a clear path for their future advancement.
If you’ve been in the software development industry previously, you’ve probably seen the typical “competency matrix” for defining what a Junior, Mid-level, and Senior developer should look like at a given organization.
For example:
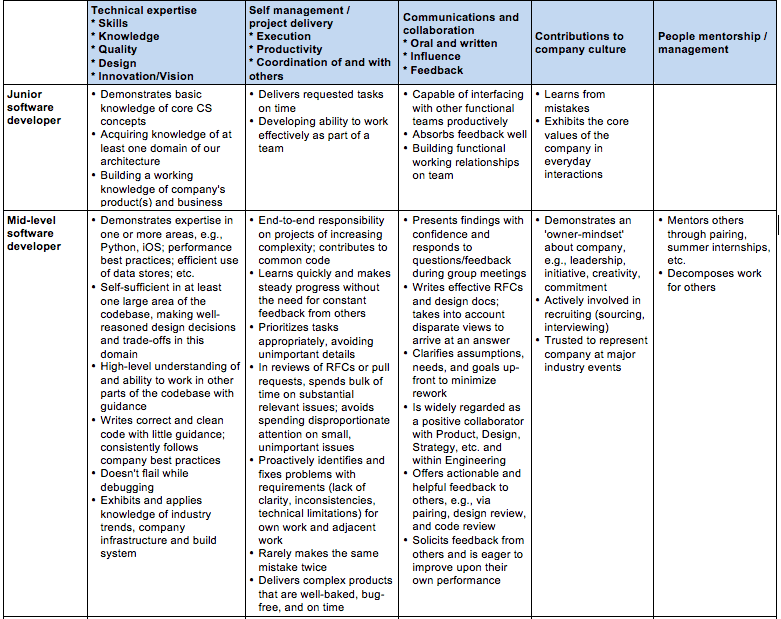
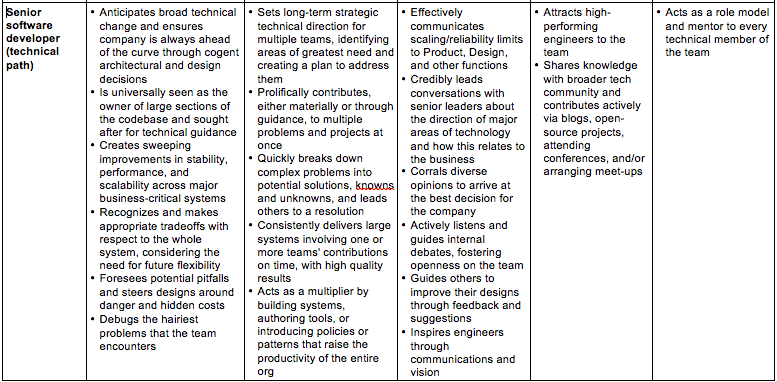
While frameworks like these work, we had a handful of reasons for wanting to avoid this approach:
As you can see from the points above, we really wanted to find an approach that is much more granular than what is typically used, so that our developers can have a clearer growth path that’s more individualized to their current skill set and experience. Enter Engineering Ladders…
When we came across the engineering ladders repository and started looking into its approach, we instantly felt it was a much better way of visualizing and quantifying developers’ skills.
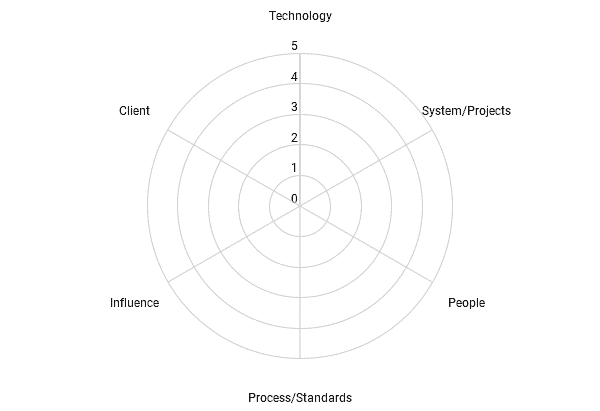
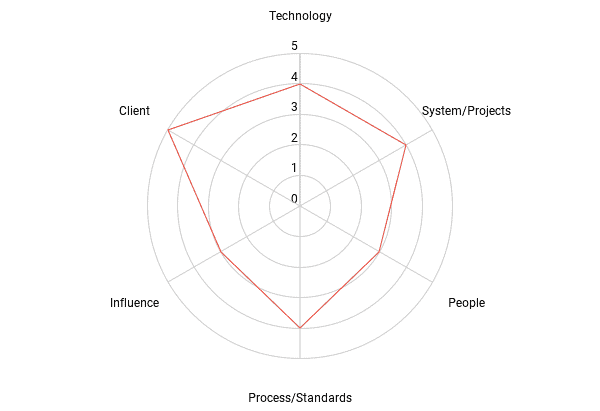
To give a quick overview, this framework uses radar charts to visually represent the different perspectives and expectations of a given position. These radar charts are made up of 5 axes that represent the main areas of interest when assessing developers. Those being:
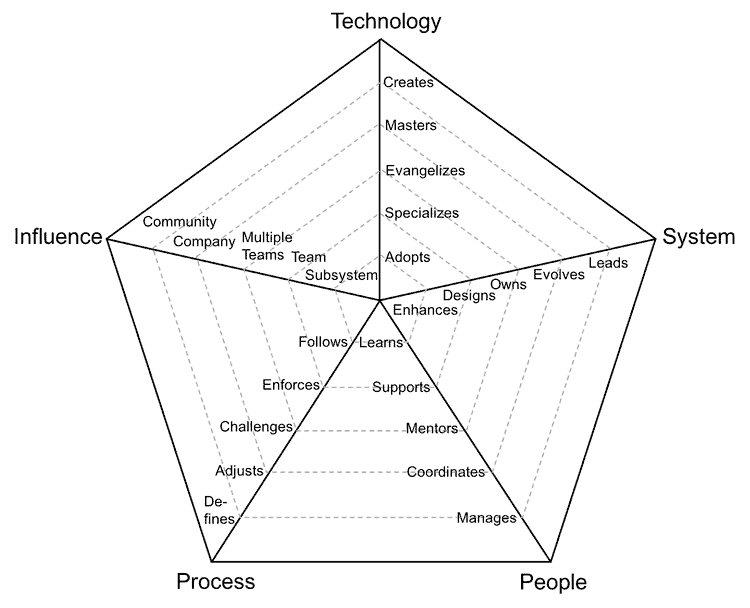
Base Engineering Ladder Template
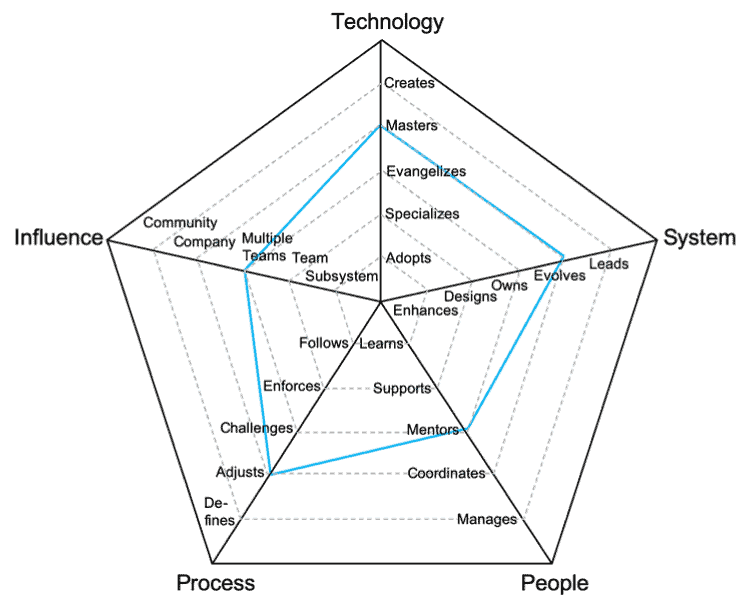
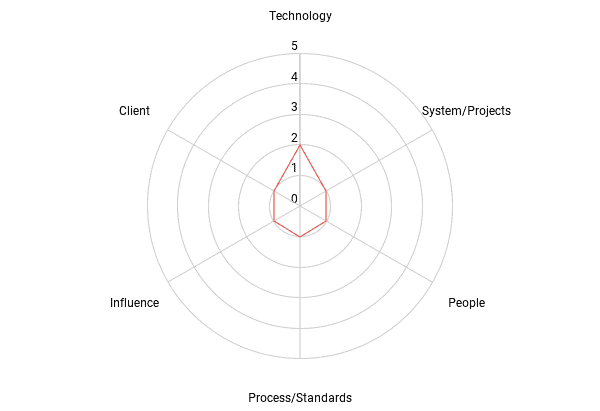
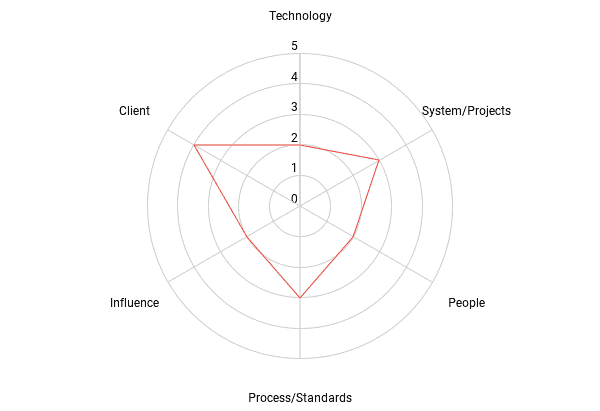
Example Engineering Ladder for an Individual
Within each axis are five different levels of performance, each including the previous ones. I won’t list them here, but they can be viewed in the “Levels” section of the repository here.
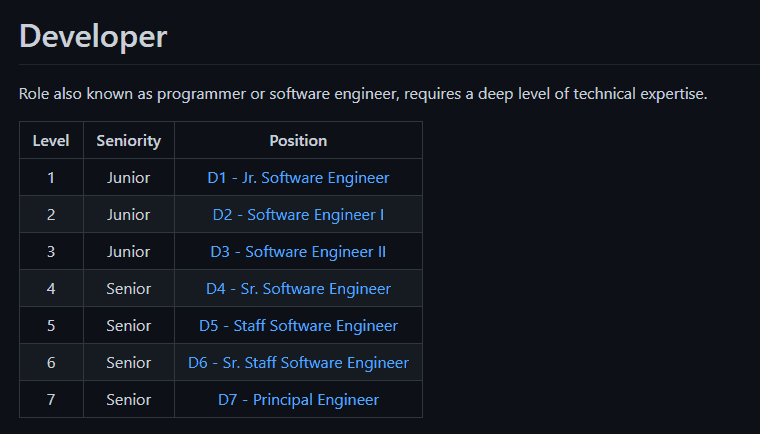
The framework also has defined levels for developers, ranging from D1 through D7, which can be seen here. Some forks of this repository have even taken the liberty of mapping these levels to match some common “Big Tech” titles:
We saw this framework as an excellent starting point and decided the core concepts would be a great foundation for us at BizStream.
Even though the engineering ladders approach was the route we wanted to take, there were a few key areas that we could address to make this framework fit BizStream even better, which are expanded upon below.
When we first assessed the engineering ladders approach, we felt like it covered most aspects of what we look for in developers but needed just a few minor tweaks to be tailored to how BizStream runs and operates.
BizStream’s Engineer Ladder Template
BizStream Junior
BizStream Mid
BizStream Senior
We decided to update the System axis to better match the type of work we do at BizStream, which mainly involved changing some of the verbiage of the levels to be more “project” focused and less “system” focused.
For the Process axis, we made a similar update to what we did with the System axis, in which we modified the verbiage to also encompass development standards. Although one could easily argue that development standards are a subset of processes, we felt it was beneficial to explicitly call them out so developers didn’t just think about standard processes like code reviews and branching strategies.
As an agency, one of the main activities our developers’ experience is interacting and interfacing with clients. Since this is such a large aspect of the developer role at BizStream, we felt it was necessary to create a new axis that allowed us to measure client involvement.
As we’ll discuss in the data collection section below, we wanted to make sure we had some real-world examples of what it might look like for a developer to be at a given level in each axis, so we went through and added some “true to BizStream” examples under each level within each axis. This was done to try and remove as much ambiguity as possible when reviewing the different levels in each axis.
As referenced above, the original framework has predefined developer levels (D1 through D7), depending on where a developer stands across all the different axes. Although we believe this to be better than the standard Junior, Mid-level, and Senior levels, we still didn’t like the idea of having explicit titles for our developers. One of the main reasons for this decision is down to the variability that will exist for each individual developer. We feel it’s much better to assess the area of a developer’s chart to determine overall aptitude rather than trying to shoehorn them into predefined levels.
One of the main benefits of this framework, combined with the changes we made to fit our specific needs, enabled us to easily gather all the data we needed by conducting a self/peer review process. This process involved every developer at BizStream filling out a form that allowed them to review themselves and decide which level within each axis they felt they were currently at. They would then fill out this form for every other developer on their team so we would have their assessment of all the other developers on their team. We also added an extra data point for each developer by allowing their manager to provide their input in the same way since their manager would likely have some additional insights that their peers might not.
We then took all these data points and used the median values from all responses for an individual to determine where they stand within a given axis. We found this worked better than taking an average since it would give us an explicit value rather than a decimal value that needed to be rounded up or down, which we found caused results to be skewed up or down depending on what rounding approach we took.
In addition to using the median to determine the outcome for a given axis, we also looked at the standard deviation of the responses to look for any inconsistencies in the review process. This helped us to better understand where additional examples or clarifications needed to be implemented so we could ensure our data was as accurate as possible (which isn’t the easiest when there’s lots of subjectivity involved). The standard deviation also helped us find places where additional discussions needed to occur. If we found instances where not many people were in agreement with where someone’s skills were, we would pull the necessary people together to get a better understanding of where they should be assessed to ensure that the data we have is as accurate as possible.
Once we had all the data we needed and verified that it was as accurate as possible, we had to find the best way to share this information with the developers at BizStream. To accomplish this, we decided to build individual reports for every developer that contained the following information:
Once all this information had been placed in a report, a meeting was scheduled to review the document with the developer. The finished report was also shared with the developer afterward for them to review and reference at any point in the future.
These reports are a great tool for developers and their managers to generate topics for discussion in one-on-ones and/or quarterlies. This gives developers and their managers the freedom to focus on whatever areas they believe matter the most.
Overall, this new approach to assessing developers is a step in the right direction. While this was only the first year that we’ve attempted this approach, it was well received by the team as a great way to quantify where they stand as a developer at BizStream. We also received some great feedback that we’re excited to implement the next time we run through this process. One of the most significant improvements is an addition to the reports outlining what steps must be taken in each axis to jump to the next level. This gives developers a clear path of actionable steps that can be taken to expand their areas of expertise and make a larger impact at BizStream.

Stay up to date on what BizStream is doing and keep in the loop on the latest in marketing & technology.